
Figure 2.
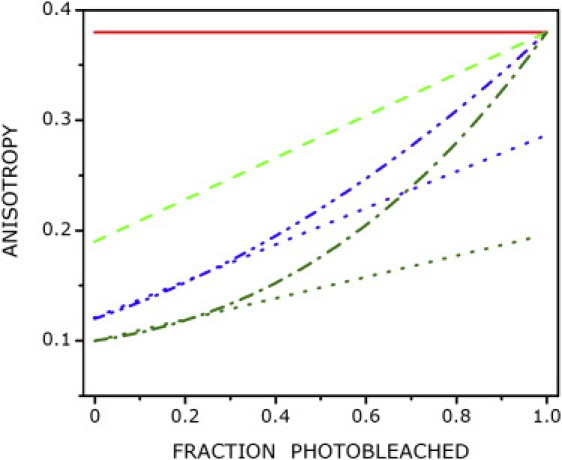
Simulation of anisotropy enhancement upon photobleaching for a population of homogeneous oligomers containing N subunits. N-values correspond to 1 (monomer, red —), 2 (dimer, light green —-), 3 (trimer, blue –– - - ––), and 4 (tetramer, deep green –– - ––). Simulations were generated using the theoretical formalism developed by Yeow and Clayton (14). The extrapolated anisotropies derived from initial points corresponding to fractional bleaching (<0.3) in the case of trimer and tetramer are also shown (………). See Materials and Methods for other details.