
Figure 5.
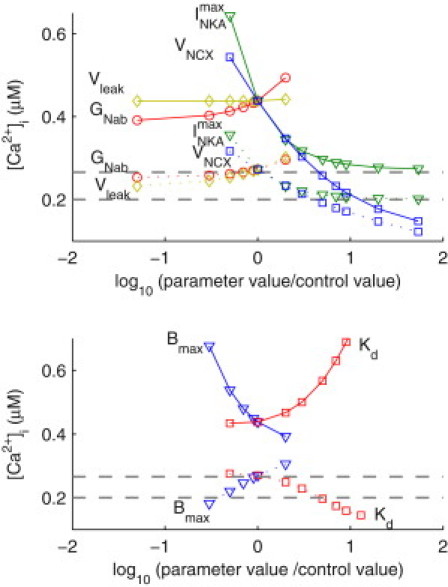
(Top) Changes in peak (solid lines) and diastolic (dotted lines) [Ca2+]i in response to changes in the conductances of the persistent Na+ current (GNab), the SR Ca2+ leak flux (Vleak), the Na+/K+ ATPase current (GNKA) and the NCX (VNCX). Dashed lines indicate the experimentally measured peak and diastolic [Ca2+]i in the KO cardiomyocytes. (Bottom) Changes in peak (solid lines) and diastolic (dotted lines) [Ca2+]i in response to changes total buffer concentration (Bmax) and affinity (Kd).