
Figure 2.
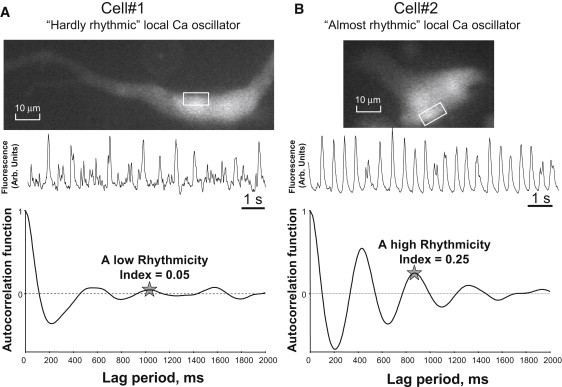
Examples of time series and autocorrelation analysis of local Ca2+ signals of different rhythmicity in SANCs: cell 1 exhibited LCRs of low rhythmicity (A) and cell 2 exhibited LCRs of high rhythmicity (B). The fluorescence time series were measured (middle panels) within active spots generating rhythmic LCRs (within white contours on cell fluorescence images, top panels). (Bottom panels) Autocorrelation function estimates calculated for 42 s and 87 s of LCRs activity in cells 1 and 2, respectively.