
Figure 4.
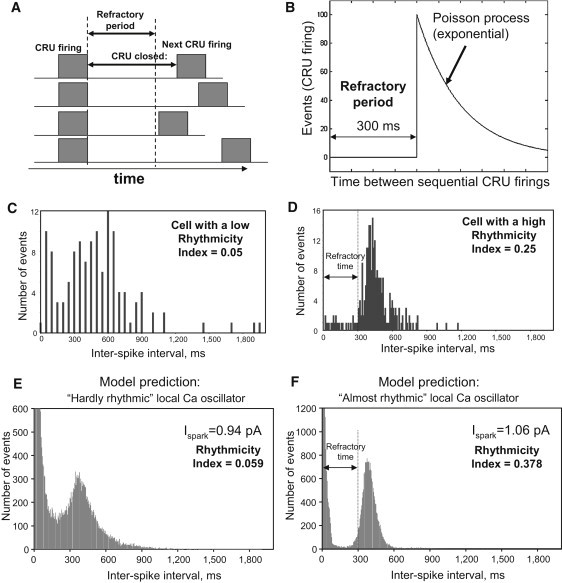
(A) Schematic illustration of the refractory period. (B) Illustration of CRU stochastic firing as a Poisson process after the refractory period, at a given submembrane [Ca2+] level in our model: CRU firing events have a shifted, exponentially distributed interevent time-distribution (times to next opening). (C and D) Experimental interevent time-distributions of LCRs in cells with different Rhythmicity Index. The distribution exhibits a clear time lag with almost no firing, followed by a peak with an abrupt rise and a gradual exponential-like decay in SANCs exhibiting LCRs with high Rhythmicity Index (panel D). This pattern was obscure in cells with LCRs of low rhythmicity (panel C). Results in panels C and D are from same cells shown in Fig. 2, A and B, respectively. (E and F) Numerical model simulations reproduce this experimental result.