
Figure 5.
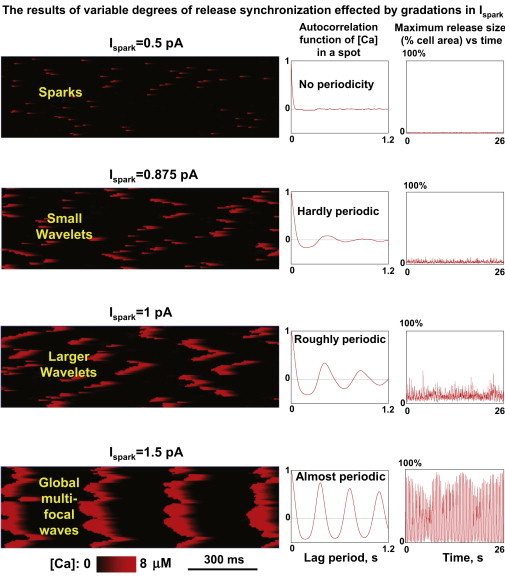
Results of numerical model simulations of local Ca2+ dynamics in the submembrane space at different Ispark. (Left panels) Variable degrees of local Ca2+ release synchronization in line scan images through entire cell length; transition from sparks to global waves. (Middle panels) Autocorrelation function estimate (for 50 s simulations). (Right panels) Instant maximum release size versus time.