
Figure 6.
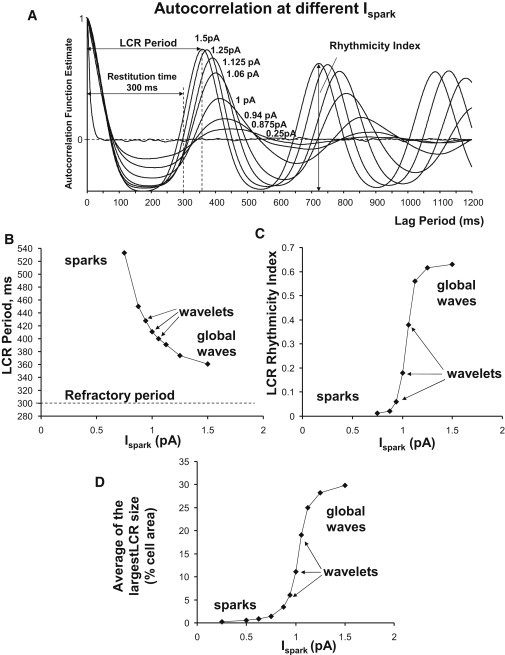
Predicted characteristics of LCRs at different Ispark. (A) Superimposed autocorrelation function estimates (for 50 s simulations). (B) LCR periods assessed from autocorrelation functions. (C) LCR Rhythmicity Index. (D) Time average of the largest LCR size.