
Figure 1.
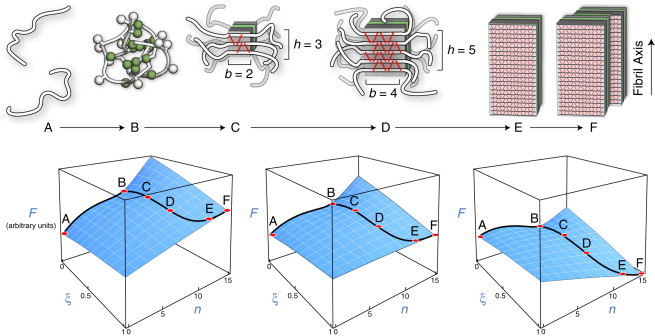
(Upper) Model of amyloid aggregation equilibria. Each black line indicates the peptide backbone. Each red line represents one hydrogen bond. (State A) Isolated peptide monomers in solution. (State B) Oligomeric assembly of a few peptide chains. (State C) Nucleus of β-sheet structure. The peptide backbone runs perpendicular to the fiber axis. (State D) Postcritical nucleus structure showing more β-structure. (State E) A protofilament is a single long thread of β-structure consisting of a β-sandwich and two face-to-face β-sheet planes. (State F) The full fibril, a bundle of protofilaments shown here to contain p = 2 protofilament threads. (Lower) Schematic representations of the free-energy (F) landscape at low (left), intermediate (middle), and high (right) peptide concentrations, as described by our model. Labels correspond to the states depicted above. At low concentrations, the monomer state (state A) is the free-energy minimum, whereas at high concentrations, the fibril (State F) is the minimum. At intermediate concentrations, the solution depends sensitively on the relative stabilities of the fibril and oligomer states.