
Figure 8.
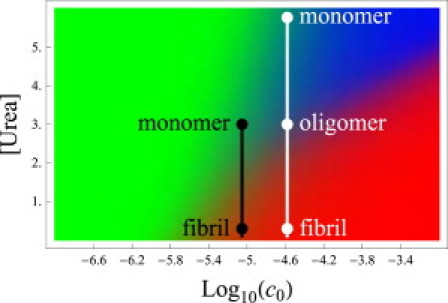
Phase diagram for Aβ as a function of peptide concentration and urea concentration. The colors represent monomers (green), oligomers (blue), and fibrils (red). N = 4 and χNL = 36.4 (19), and all other parameters are identical to those in Fig. 5. This diagram explains a discrepancy between the experiments of Chen and Glabe (19) and Kim et al. (50). The black line indicates the denaturation pathway of Chen and Glabe, who found no intermediate oligomers. For the Kim experiments, denaturation is indicated by the white line and shows an oligomeric state at intermediate urea concentrations.