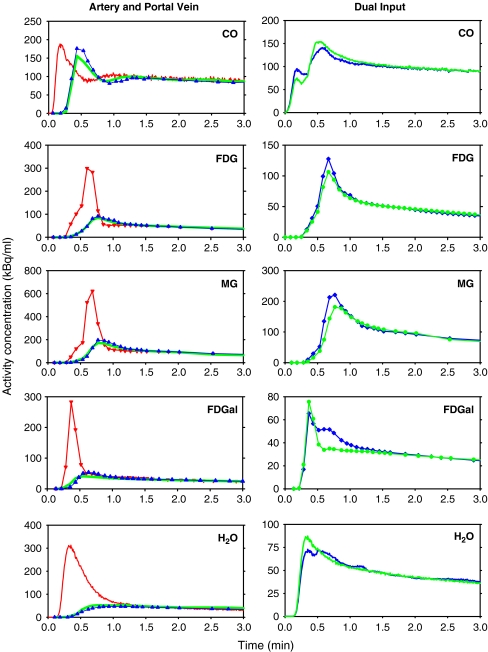
Fig. 1.
Left Examples of blood tracer activity concentration time-courses following bolus administration of tracers to pigs measured in a femoral artery, C
A(t) (red curves); measured in the PV, C
PV(t) (blue curves); PV model-derived,  (green curves) calculated from C
A(t) using means of the tracer-specific parameters for the passage of the tracer from the intestinal arteries to the PV,
  s (Eq. 4). Right For each tracer, the measured dual input, C
dual(t) (blue curves), was calculated from C
A(t) and C
PV(t) shown on the left and the individually measured HA blood flow fractions, f
HA (Eqs. 1 and 2). The corresponding model-derived dual input,
  (green curves), was calculated from C
A(t) and
  and the mean HA blood flow fraction, f
HA (=0.25; Eq. 5)

