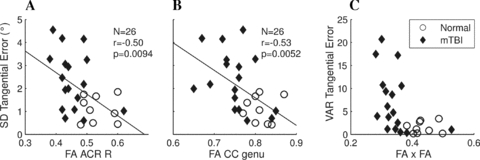
Figure 2.

Relationships between FA values and visual tracking performance variability in the tangential direction of the target trajectory. (A) Right ACR. (B) Genu of the corpus callosum (CC). The regression lines were determined from the combined subject population. (C) Cross-factorization of A and B (multiplication of respective abscissa and ordinates). Circles, normal subjects; Diamonds, subjects with chronic postconcussive symptoms; SD, standard deviation; VAR, variance.
