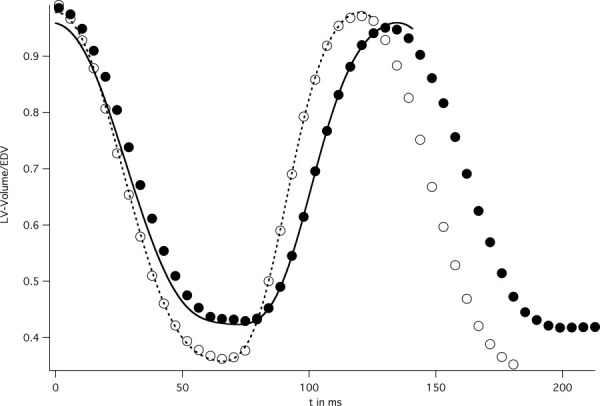
FIG. 6.

Representative time volume curves for the entire left ventricle, normalized to the end diastolic volume. The volumes were obtained from threefold undersampled TGRAPPA cine data acquired over two cardiac cycles under baseline conditions (“•” symbols) and under intravenous dobutamine infusion (“○” symbols). Both curves were fitted (lines) to obtain left-ventricular peak-filling and ejection rates.
