
Figure 3.
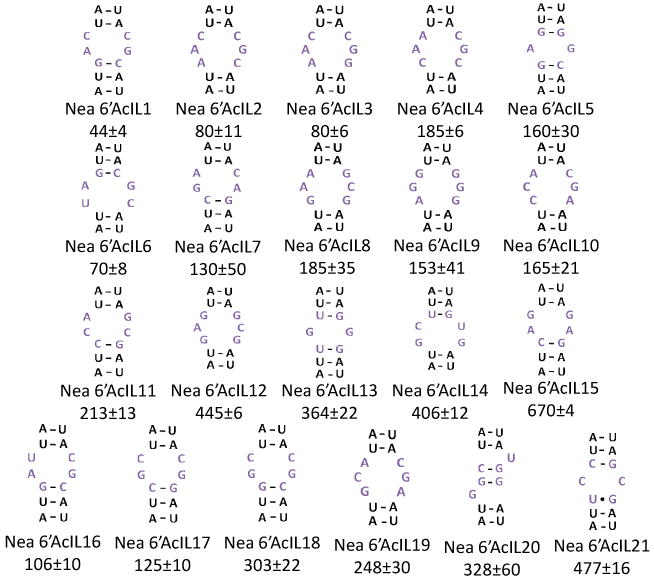
The secondary structures of the internal loops selected to bind 1; nucleotides shown are derived from the boxed region of 2 (Figure 1c). The top three rows correspond to sequences identified from sequencing data while the bottom row contains members of 2 not found in the original selection, but whose summed Z-scores correlate with affinity (Figure 4). The value below each loop is the Kd (nanomolar) of the RNA-1-Fl complex.