
Figure 1.
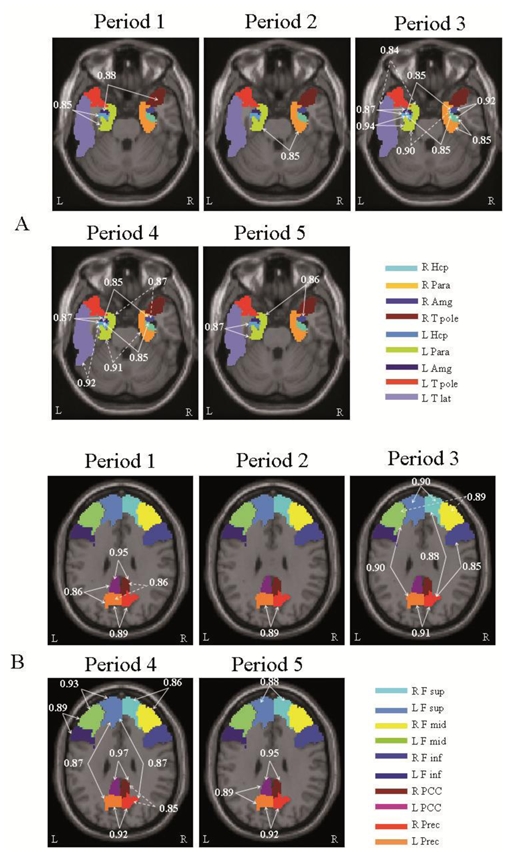
Schematic illustration of results from the correlational analyses between (A) subregions of the MTL and neocortical regions and among MTL regions and (B) extra-MTL neocortical regions, for each time-period. Numeric values represent significant correlational coefficients (r2) between the two subregions connected by arrows (pcorr < 0.000125).
Abbreviations: Amg = amygdala, F sup = superior frontal gyrus, F mid = middle frontal gyrus, F inf = inferior frontal gyrus, Hcp = hippocampus, L = left; Para = parahippocampal gyrus, PCC = posterior cingulate gyrus, Prec = precuneus, R = right; T lat = lateral temporal gyrus, T pole = Temporal pole.