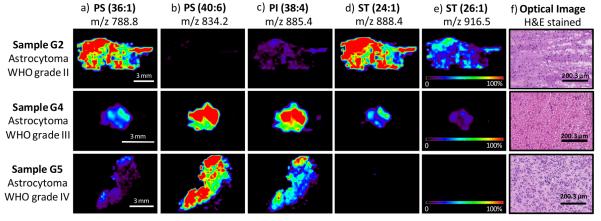
Figure 3.
Selected negative ion DESI-MS images from three of the different glioma samples analyzed, sample G2 (diffuse astrocytoma WHO grade II), sample G4 (anaplastic astrocytoma WHO grade III) and sample G5 (glioblastoma, astrocytom a WHO grade IV), showing the distribution of a) m/z 788.8 (PS 36:1), b) m/z 834.2 (PS 40:6), c) m/z 885.4 (PI 38:4), d) m/z 888.4 (ST 24:1), e) m/z 916.5 (ST 26:1). Optical images of the stained tissue sections are shown in f).

