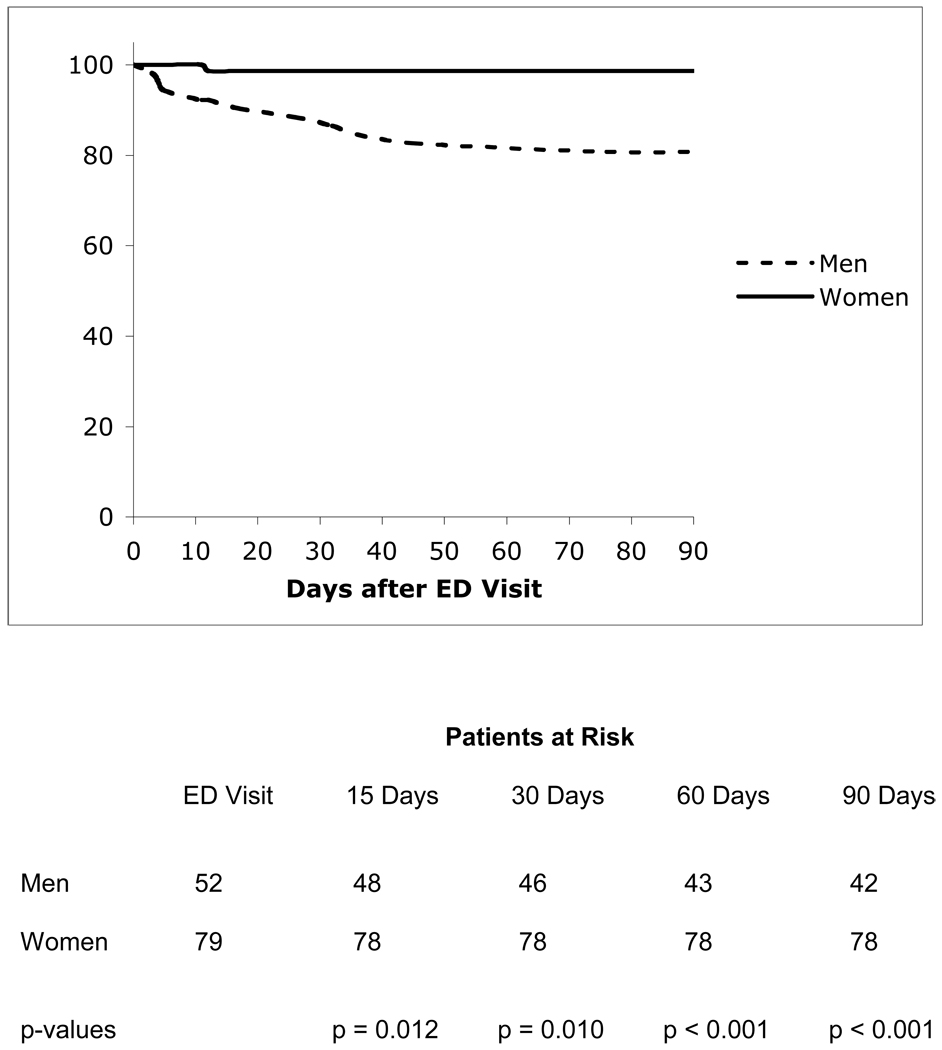
FIGURE. Survival Curves to 90 Days of Follow-up.
Kaplan-Meier survival of patients, stratified by men (broken line) and women (solid line), seen in the Emergency Department (ED) with abdominal pain. The number of patients alive at the time of the ED visit, and at 15, 30, 60, and 90 days of follow-up, is displayed below the figure. P-values compare the survival curves of men and women at each time point, by the log-rank test.

