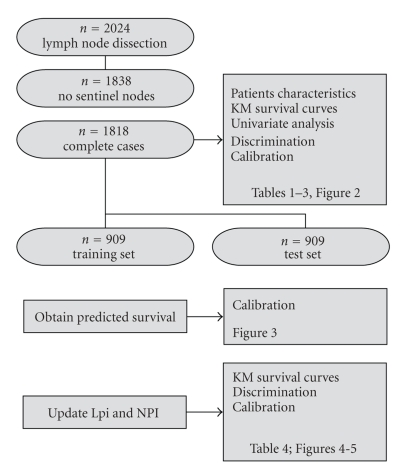
Figure 1.
Flow chart: from the 2024 patients treated in our institution, 1,818 were eligible for this study. This cohort was used to summarize patient characteristics, Kaplan-Meier survival curves, and univariable survival analysis. The discriminating ability of the NPI and Lpi were compared on this cohort. Calibration of both models was checked on the test set (a random half of the data), after obtaining the predicted survival curves on the training set. The same training set was used to update both models. Kaplan-Meier curves, discrimination, and calibration ability of the updated models were calculated on the test set.

