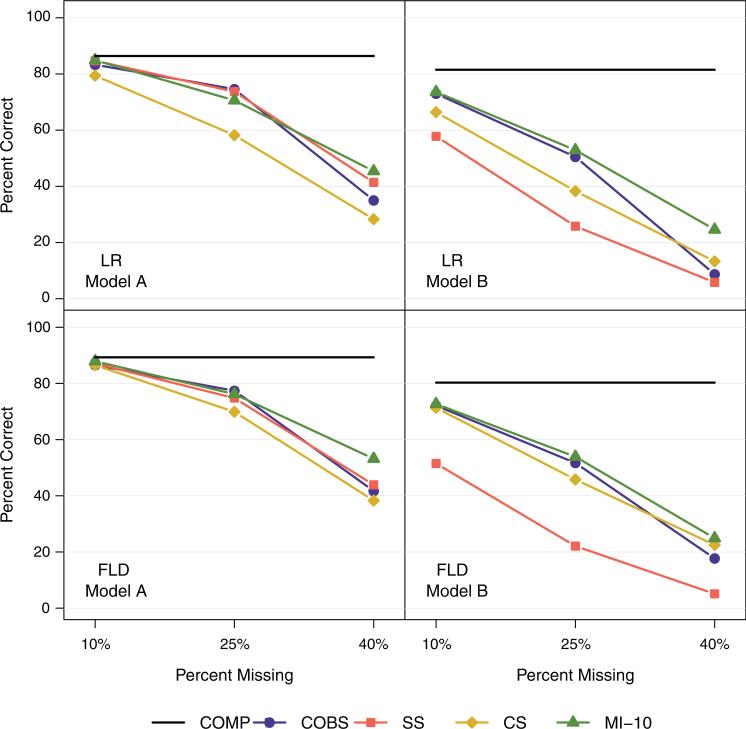
Figure 3.
Percentage of models that identified the correct splitting covariate at all four nodes. FLD, reduction in full exponential likelihood deviance statistic; LR, two-sample log rank statistic; COMP, full simulated data; COBS, completely observed cases only; SS, surrogate splitting; CS, Conversano and Siciliano's single imputation; MI-1, multiple imputation with one draw of normal error; MI-10, multiple imputation with 10 draws of normal error.

