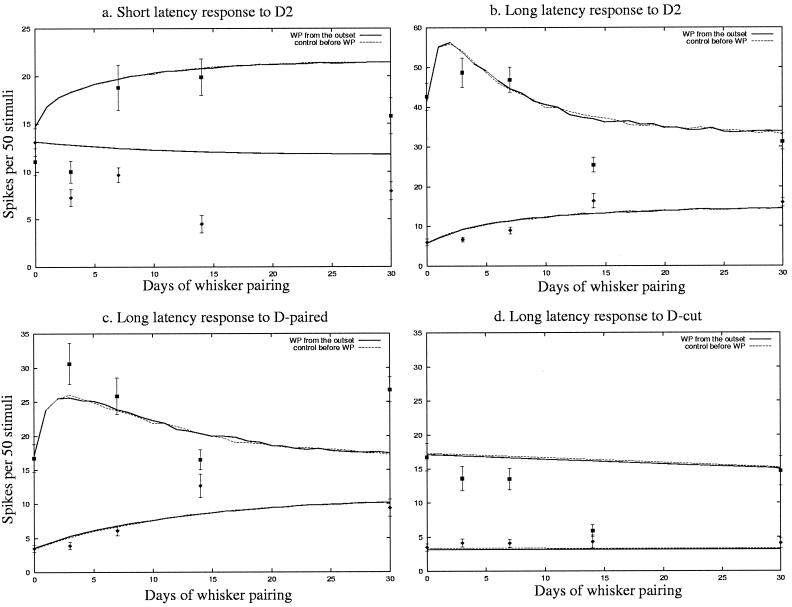
Figure 2.
Evolution of short (0–10 ms poststimulus, a) and long latency (10–100 ms poststimulus, b–d) cell responses evoked in the simulated and real barrel-column D2, for the normal cortex (upper curves and squares) and for the impaired cortex (lower curves and diamonds). Discrete points denote average experimental values ± SE (12). We also compare two input environments, i.e., whisker pairing (WP) from the outset (solid lines) and control before WP (dashed lines). Each curve point is an average of 50 different runs.

