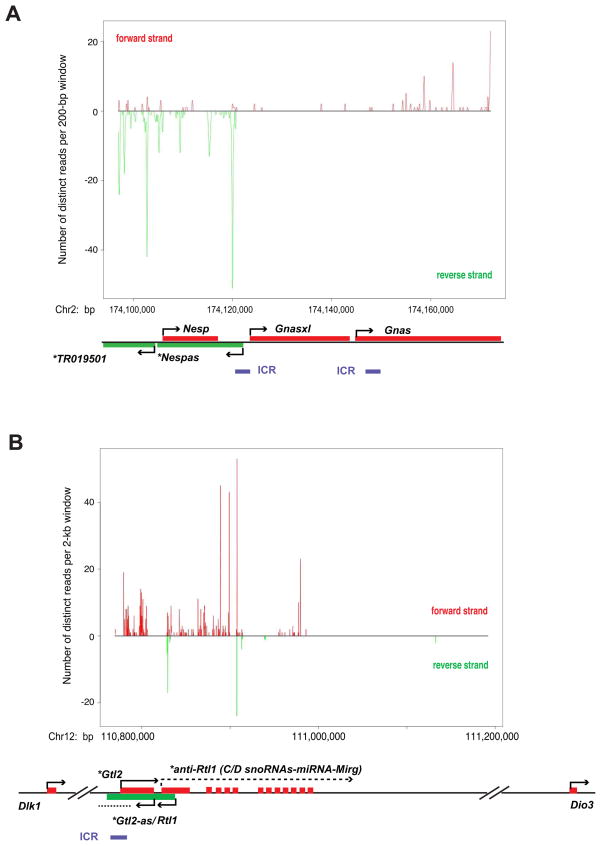
Figure 3. Hits to select imprinted loci.
A,B. Read density plots for Nesp/Gnas (A) and Dlk1/Gtl2 (B) imprinted clusters. Distinct reads are smoothed with sliding consecutive 200-bp or 2-kb windows on the x-axis and their representations plotted on the y-axis. *, ncRNA. Chr, chromosome. Red, forward strand; green, reverse strand. The Ezh2−/− library is depleted of these reads.

