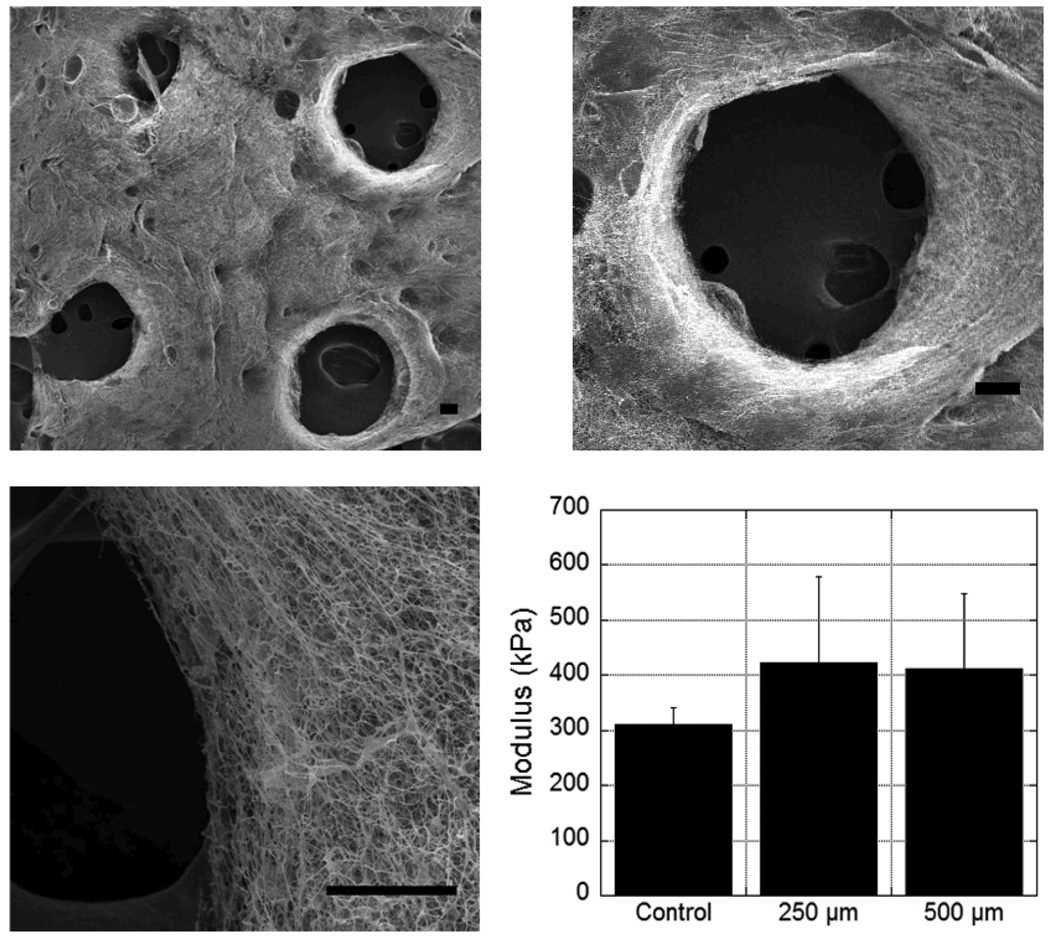
Figure 3.
(A) SEM images of scaffold structure at various magnifications after removal of unreacted HA and PEO, illustrating pore formation and stability of fibers during processing (scale bars = 100 µm (top 2 images) or 50 µm (bottom image)). (B) Modulus of patterned scaffolds (250 or 500 µm pores) after processing and drying compared to uniform scaffolds. There were no statistical differences (p>0.05, ANOVA) between any of the scaffolds.

