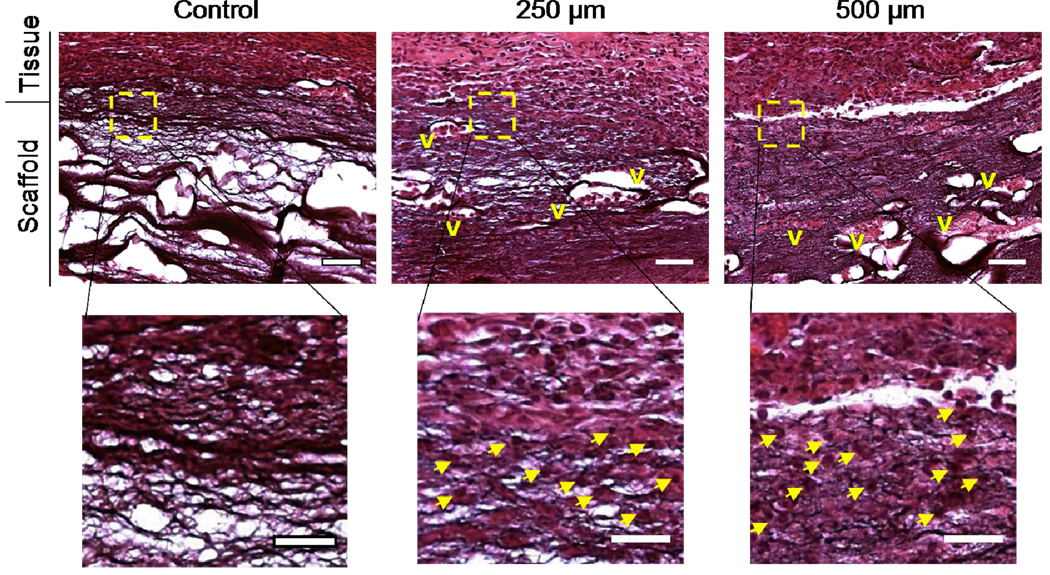
Figure 4.
Representative images of cellular infiltration into electrospun scaffold implants 1 week post-implantation at either low (top, scale bar = 200 µm) or high (bottom, scale bar = 100 µm, regions from boxed area in less magnified images) magnification (V = vascular structures, arrows indicate representative nuclei). Although the control scaffolds stain purple with the stain, they are acellular and do not contain vascular structures, whereas both patterned macro-porous scaffolds show increased cell infiltration into the scaffold.

