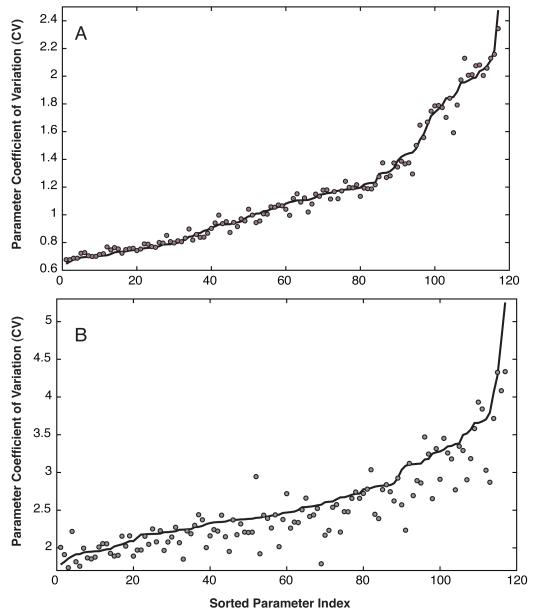
Fig. 3.
Coefficient of variation (CV) of model parameters estimated using POET with local parameter refinement (A) and the original implementation (B). The solid line denotes the mean CV calculated over the entire ensemble while the points denote the CV of the ensemble sample used in the sensitivity analysis calculations. Approximately 47% or 55 of 117 parameters had CV ≤ 1 for POET with local refinement. The minimum CV obtained using the original POET implementation was 1.7.

