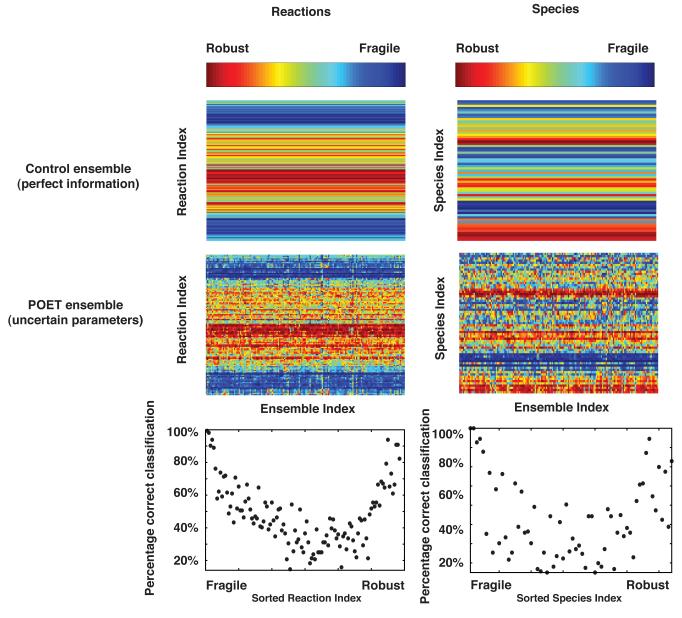
Fig. 8.
Comparison of the reaction (edge) and species (node) rank estimated from the ensemble versus the true parameter set for β =1. The ordinal-rank of the magnitude of the left (right) singular vector corresponding to the largest singular value was computed for true model (top) and the model ensemble (middle). The fraction of trials a species or reaction was ranked exactly correctly was used to calculate the correct classification percentage.

