
Figure 3.
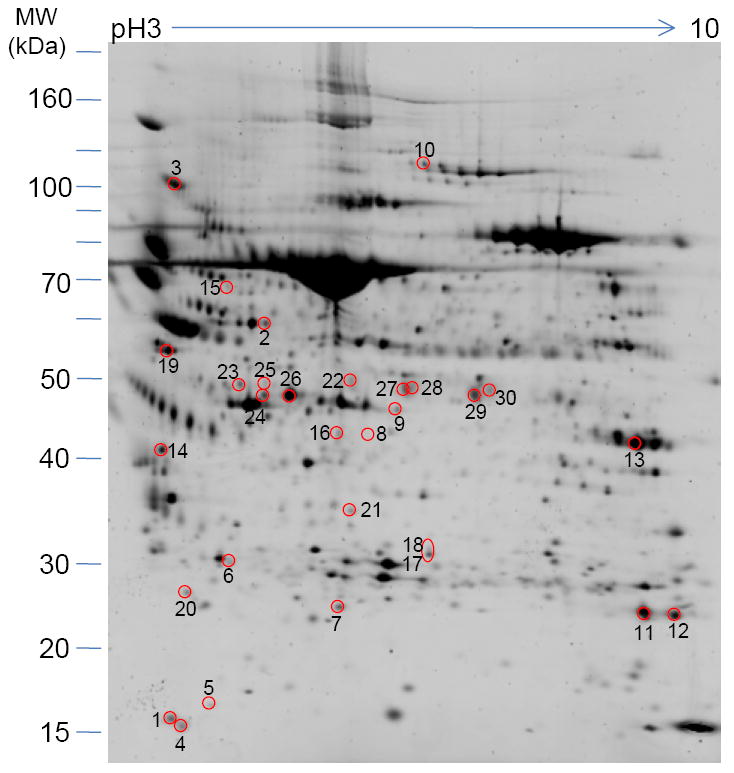
Two-dimensional gel electrophoresis profile of murine BAL fluid. Aliquots of BALF supernatants corresponding to 6 mice in each group were pooled and precipitated with 75% ethanol. BALF protein (100 μg) was isoelectric focused on 17-cm IPG (pH 3-10) strips followed by 8-10% SDS-PAGE. After Sypro-Ruby staining, intensity of the spots was determined by PDQuest software (Bio-Rad). Proteins with enhanced or decreased expression levels in the presence of OVA plus UF compare to OVA alone were selected and identified by LC-MS/MS. Those proteins are numbered and their identities disclosed in Table 1.