
Figure 4.
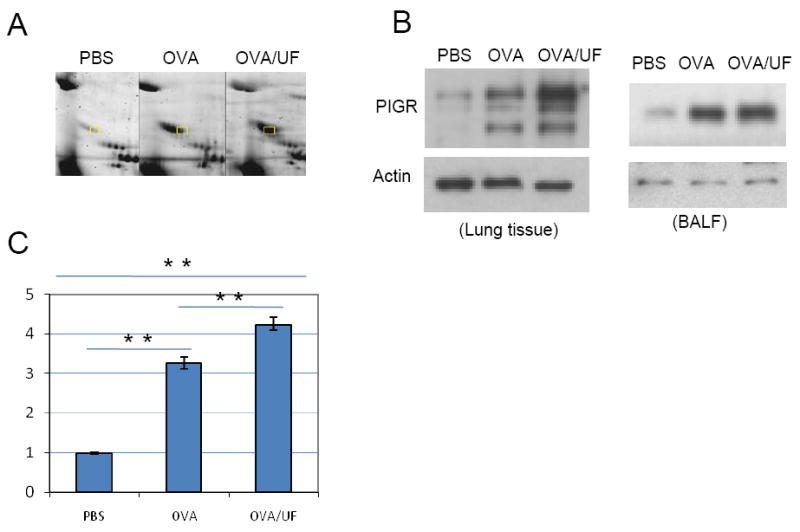
Differential expression of polymeric immunoglobulin receptor (PIGR). (A) Two-dimensional gel electrophoresis profile of PIGR. BAL fluid protein (100 μg) was separated on 17-cm IPG (pH 3-10) strips, followed by 8–16% SDS-PAGE. Proteins were stained with Sypro-Ruby. LC–MS/MS identified PIGR were labeled. (B) Western blot analysis of PIGR level in the lung (left panel) and in the BALF (right panel). Lung tissue protein (50 μg) and BALF protein (20 μg) from three different groups were electrophoresed on 8-16% SDS polyacrylamide gels before transfer to nitrocellulose membranes. Goat anti-mouse PIGR polyclonal antibody was used at 0.1 μg/mL. (C) Real-time RT-PCR analysis. Samples were run in triplicate and the standard curves were duplicated on a single 96-well PCR plate. PCR data was analyzed using the Pfaffl method. **p<0.01.