
Figure 5.
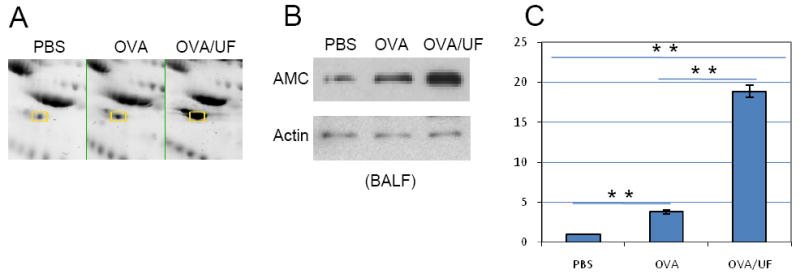
Differential expression of acidic mammalian chitinase (AMCase). (A) Two-dimensional gel electrophoresis profile of AMCase. AMCase spots are labeled. (B) Western blot analysis of AMCase level in the BALF. Polyclonal goat anti-mouse AMC antibody was used at 1:1000. (C) Real-time RT-PCR. **p<0.01.