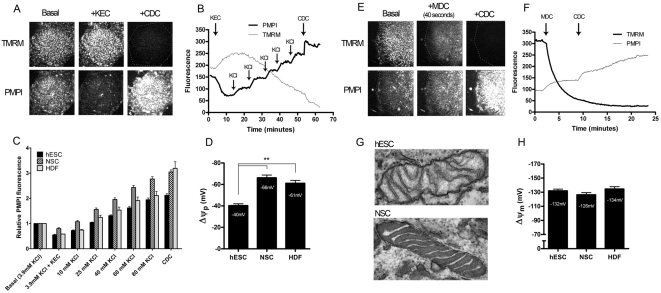
Fig. 4.
Resting plasma and mitochondrial membrane potential determination in hESCs and differentiated cells. (A) Time-lapse images of a hESC colony labelled with TMRM and PMPI potentiometric probes, under basal conditions, following addition of the K+ equilibrium cocktail (KEC) and the complete depolarisation cocktail (CDC). (B) Fluorescence intensity traces corresponding to A. Following the KEC addition, sequential replacement steps with KCl-based medium were performed as indicated. Finally the plasma membrane was completely depolarised with the addition of the CDC. (C) Mean normalised PMPI fluorescence values obtained for the three indicated cell types at the indicated extracellular K+ concentrations. (D) Mean (+s.e.m.) resting plasma membrane potentials for hESCs, NSCs and HDFs (hESC and NSC, n=8; HDF, n=3). Potentials were derived from C as given in the supplementary methods. (E) Time-lapse images of a hESC colony labelled with TMRM and PMPI, under basal conditions, 40 seconds after addition of the mitochondrial depolarisation cocktail (MDC) and after addition of the CDC. (F) Fluorescence intensity traces corresponding to E. Mitochondrial depolarisation was triggered with the MDC as indicated and finally complete depolarisation was achieved with the CDC. Parameters derived from the fluorescence traces are shown in supplementary material Fig. S3. (G) Electron micrographs of typical mitochondria in hESCs and NSCs (viewed at 105,000×). (H) Mean (+s.e.m.) resting mitochondrial membrane potential values for hESCs, NSCs and HDFs (hESC, n=28; NSC, n=16; and HDF, n=13). Potentials were derived from experiments similar to those shown in F and as given in the supplementary methods. The statistical significance was calculated from a one-way ANOVA using Dunnett's correction. **P<0.01.

