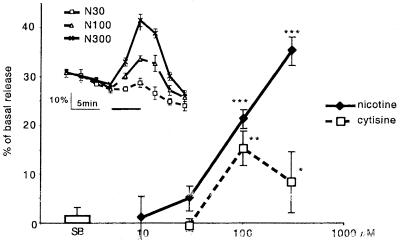
Figure 1.
Dose–response curve of the effects of nicotinic agonists on [3H]5-HT efflux from mouse spinal cord slices (for calculation of the response amplitude see Materials and Methods). Nicotine (n = 4–36) and cytisine (n = 4–6) responses were compared to the control, SB (n = 18), response. Statistical analysis according to one-way ANOVA followed by Dunnett's test for treatment vs. control comparisons: *, P < 0.05; **, P < 0.01; and ***, P < 0.001. (Inset) Averaged traces for [3H]5-HT efflux elicited by 30, 100, and 300 μM nicotine.

