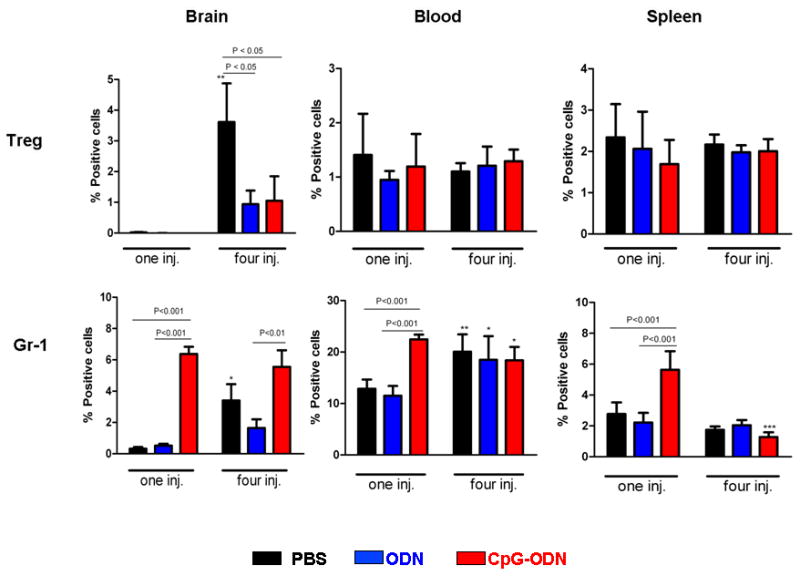
Figure 3.

Effect of CpG-ODN on regulatory T cells (Treg) and myeloid-derived suppressor cells (MDSC, Gr-1). Mice bearing four day-old intracranial GL261 tumors were treated with CpG-ODN (3μg/injection), control ODN (3μg/injection), and PBS once (one inj.) or four (four inj.) times as described in Fig. 1. Twenty-four hr after the last injection, brain, spleen, and blood were harvested and analyzed by flow cytometry for Treg and MDSCs by flow cytometry. P values for significant differences between treatment groups are provided above each bar graph. Significant differences between one and four injections for each treatment is represented as *: p<0.05, **: p<0.001, ***: p<0.0001. n=4 mice for each treatment group. Data is representative of two separate experiments.
