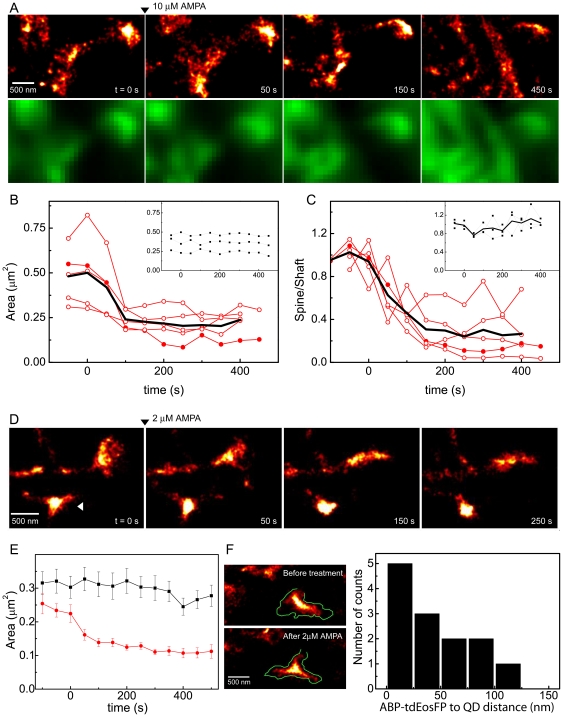
Figure 6. Structural dynamics of synaptic spines during AMPAR activation.
(A) Upper panels: super-resolution time-lapse imaging of a single spine from a DIV 28 neuron expressing ABP-tdEosFP. AMPA was added at t = 0 at a final concentration of 10 µM (arrowhead). Lower panels: average projection of the raw frames used for PALM reconstruction. (B) Quantification of the change of the area of the spine heads over time. (C) Redistribution of the actin cytoskeleton in response to the bath application of AMPA: ratio of number of counts in the spine head relative to the counts in the shaft of the spine. In both, (B) and (C), full circles represent the spine shown in panel (A) and the black line represents the averaged data (N = 5 spines from 3 cells and 3 independent experiments). In the insets to the graphs, measured control spines without treatment (N = 3 spines, 2 cells, 2 experiments). (D) PALM imaging of spines during bath application of 2 µM AMPA (DIV 27), the arrowhead indicates a spine that rounds up after treatment. (E) Quantification of the change of the area of the spine heads over time under control conditions (N = 22 spines from 6 cells and 3 independent experiments) and 2 µM AMPA treatment (35 spines, 4 cells, 2 experiments). (F) Simultaneous PALM/QD imaging of the spine cytoskeleton and the plasma membrane, before and after application of 2 µM AMPA. The outline of the membrane is superimposed as a green trace to the PALM image (left). Histogram of the distance between the cytoskeleton and the spine head during bath application of 2 µM AMPA (right, N = 13 spines, 2 cells, 2 independent experiments).

