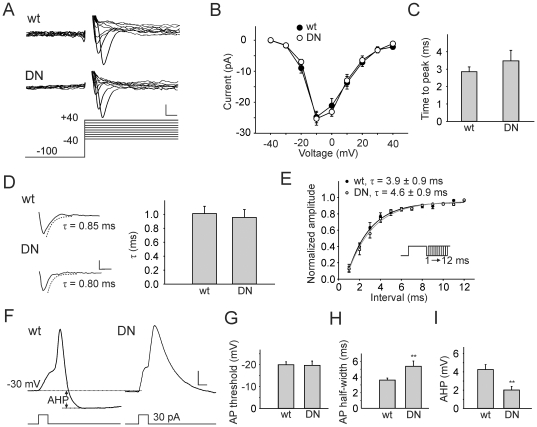
Figure 2. Kv4 Modulates Repolarization of the AP and AHP, with No Effect on the Sodium Current.
A–D, Representative Na+ current traces and analyses. Na+ currents were recorded in response to voltage jumps to potentials from −40 to +40 mV, in 5 mV increments, from a holding potential of −100 mV. For clarity, only part of the traces, corresponding to the first 18 ms of the voltage jump, in 10 mV increments are shown (A). There were no significant differences, between wild-type (wt) and DNKv4 (DN) neurons, in their I-V curves (B; N = 18 for wt, N = 9 for DN), times to peak current during a voltage jump to −10 mV (C; N = 19 for wt, N = 9 for DN, p>0.05), and time courses of inactivation during a voltage jump to −10 mV (D; N = 18 for wt, N = 9 for DN, p>0.05). Scale bars represent 10 pA and 2 ms. E, Recovery from inactivation for Na+ currents was examined in a series of paired voltage jumps, each up to −10 mV for 10 ms. The second voltage jump was initiated 1 to 12 ms, in 1 ms increments, following the first voltage jump (inset). Amplitude of the second Na+ current is expressed as a normalized fraction of the first, plotted time interval between jumps. Data were fit with a single exponential: f(t) = C+A*exp(-t/τrec). An averaged plot is shown. There was no significant difference between τrec values from wild-type and DNKv4 neurons (τrec = 3.9±0.9, N = 12 for wt; τrec = 4.6±0.8, N = 8 for DN, p>0.05). F, Single AP elicited from representative wt and DN neurons using a 5 ms injection of 30 pA (traces shown are averages of 7 consecutive recordings for each). Since AP thresholds were relatively high, we depolarized the cell to about −30 mV with a prepulse (∼30 pA, 50 ms) before evoking APs. G, AP thresholds were defined as the voltage at which dV/dt reached 2 V/s; no significant difference in the AP threshold was observed between wild-type and DNKv4 neurons (N = 11 for wt, N = 13 for DN, p>0.05). H, AP half-widths were measured half-way between the baseline (just before the AP, see dashed line) and the AP peak. AP half-widths were significantly larger in DNKv4 neurons (N = 11 for wt, N = 13 for DN). I, AHPs were measured from the baseline voltage just before the AP (see horizontal dashed line, top) to the negative peak following the AP (see horizontal dashed line, bottom), as indicated. AHPs were significantly decreased in DN neurons (N = 11 for wt, N = 13 for DN). Scale bars represent 5 mV, 5 ms. For additional characterization of the INa, see Figure S1.

