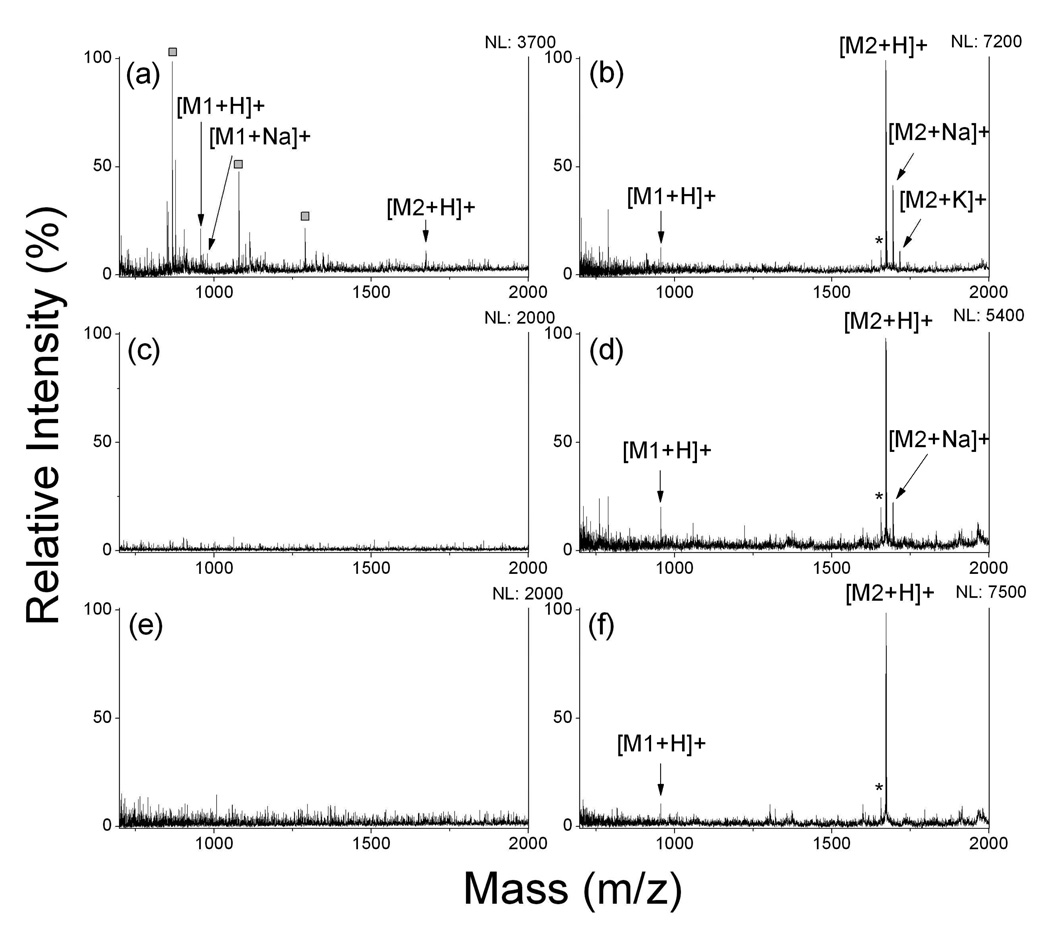
Figure 4.
MALDI and SALDI mass spectra of peptide mixture with addition of different salts. (a) 1 M NaCl, CHCA matrix; (b) 1 M NaCl, desalting&SALDI on OTS-modified calcinated surface; (c) 200 mM NaAc, CHCA matrix; (d) 200 mM NaAc, desalting&SALDI OTS-modified calcinated surface; (e) 8 M urea, CHCA matrix; (f) 8 M urea, desalting&SALDI OTS-modified calcinated surface. The analyte was the mixture of [Sar1, Thr8]-angiotensin II (M1) and neurotensin (M2), 100 fmol each. Asterisks (*) represent peaks assigned to fragment ions of peptides; squares (□) represent peaks from CHCA related ions. NL: normalized level.

