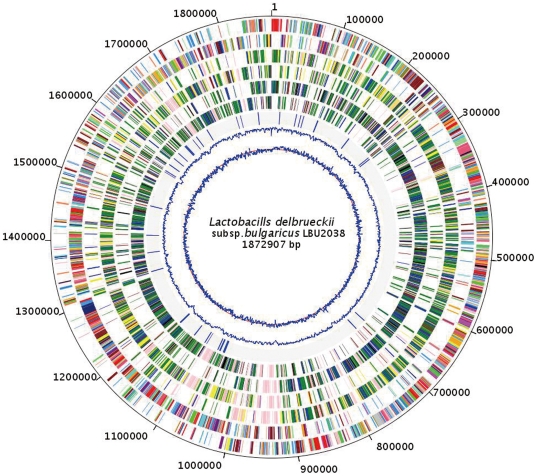
Figure 1. Chromosome Atlas of the chromosome of Lactobacillus delbrueckii subsp. Bulgaricus 2038.
Each concentric circle, number from outermost circle to innermost circle, represents genomic data for Lactobacillus delbrueckii subsp. Bulgaricus strain LBU2038 and comparison with ACCT11842 and ACCT BAA-365. First and second circles show predicted coding sequences (ORFs) on the plus and minus strands, respectively, colored by functional role categories according to COG: [J]: “Translation, ribosomal structure and biogenesis” = salmon; [A]: “RNA processing and modification” = light blue; [K]: “Transcription” = light green; [L]: “Replication, recombination and repair” = red; [B]: “Chromatin structure and dynamics” = brown; [D]: “Cell cycle control, cell division, chromosome partitioning” = yellow; [Y]: “Nuclear structure” = green; [V]: “Defense mechanisms” = purple; [T]: “Signal transduction mechanisms” = pink; [M]: “Cell wall/membrane/envelope biogenesis” = orange; [N]: “Cell motility” = blue; [Z]: “Cytoskeleton” = grey; [W]: “Extracellular structures” = sea green; [U]: “Intracellular trafficking, secretion, and vesicular transport” = black; [O]: “Posttranslational modification, protein turnover, chaperones” = aqua; [C]: “Energy production and conversion” = fuchsia; [G]: “Carbohydrate transport and metabolism” = lime; [E]: “Amino acid transport and metabolism” = maroon; [F]: “Nucleotide transport and metabolism” = navy; [H]: “Coenzyme transport and metabolism” = olive; [I]: “Lipid transport and metabolism” = silver; [P]: “Inorganic ion transport and metabolism” = lime green; [Q]: “Secondary metabolites biosynthesis, transport and catabolism” = cadet blue; [R]: “General function prediction only” = coral; [S]: “Function unknown” = dodger blue. Third and forth circles represent the conservation of the ORFs sequences compared to ACCT11842 on the plus and minus strands, respectively, colored by conservation levels: gain gene = pink; INDEL gene = yellow; non-synonymous SNP gene = green; synonymous SNP gene = blue; equal gene = dark red. Fifth and Sixth circle display the sequence comparison of each ORF to ACCT BAA-365 on the plus and minus strands, with same colors with third and forth circles for conservation levels. Seventh circle show the IS sequences. Eighth circle present the GC content of the chromosome. Ninth circle displays the GC skew of the chromosome (red circle line represent the value of zero of GC skew).

