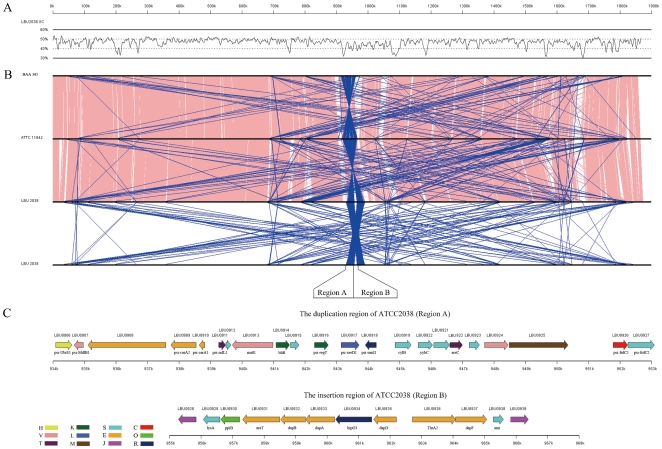
Figure 2. GC scan and the duplication regions of Lb. bulgaricus 2038 genome.
(A) The GC content of Lb. bulgaricus 2038 genome (30% to 60%). It was scanned with a window size of 5000 bp and step of 1000 bp. (B) Alignment result of genomes between Lb. bulgaricus 2038, ATCC 111842 and ATCC BAA-365 by Mummer. Pink: same direction; Blue: reverse direction. The characteristic duplication regions (A and B) flanking the predicted replication terminus are specially labeled. (C) Genes existed in the insertion and duplication regions (950k bp to 968k bp) of Lb. bulgaricus 2038. Their corresponding COG families are labeled by colors with letter specifications. [C]: Energy production and conversion; [E]: Amino acid transport and metabolism; [H]: Coenzyme transport and metabolism; [J]: Translation, ribosomal structure and biogenesis; [K]: Transcription; [L]: Replication, recombination and repair; [M]: Cell wall/membrane/envelope biogenesis; [O]: Posttranslational modification, protein turnover, chaperones; [R]: General function prediction only; [S]: Function unknown; [T]: Signal transduction mechanisms; [V]: Defense mechanisms.

