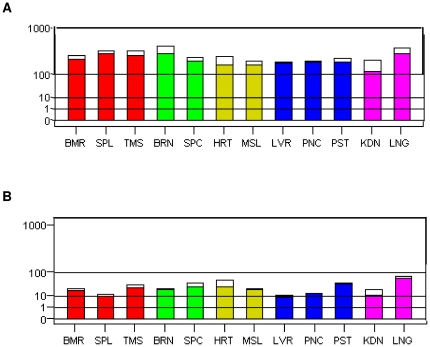
Figure 4. Microarray gene expression data for DIA1 and DIA1R.
Graphical presentation of microarray expression data for (A) DIA1 or (B) DIA1R in normal, healthy human tissues. The intensity values (shown on the root-scale y-axis) are average values, where variation in the range of measurements is represented by a white box above the coloured minimal-measurement bar. Tissues are grouped according to their origin and the groups coloured: red = immune system; green = nervous system; yellow = muscle; blue = secretory glands; pink = ‘other’. Tissue abbreviation (on the x-axis) legend: BMR = bone marrow; SPL = spleen; TMS = thymus; BRN = brain; SPC = spinal cord; HRT = heart; MSL = skeletal muscle; LVR = liver; PNC = pancreas; PST = prostate; KDN = kidney; LNG = lung. Data were obtained from the GeneNote database of human genes at the Weizmann Institute [75], and are MAS5.0 normalized data obtained using the Affymetrix HG-U95 set A–E.

