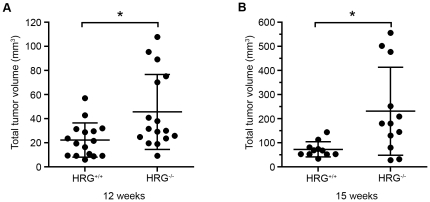
Figure 2. Tumor volume is increased in RT2/HRG−/− compared to RT2/HRG+/+ mice.
Tumors were dissected and measured. Tumor volumes were calculated by the formula ((π/6)×width2×length). Each dot represents the summarized tumor volume in mm3 from one mouse at (A) 12 weeks of age (n+/+ = 16; n−/− = 16) and at (B) 15 weeks of age (n+/+ = 11; n−/− = 12). Statistical analyses were performed with a two-tailed Mann-Whitney test, vertical bars represent standard deviation, * p≤0.05.

