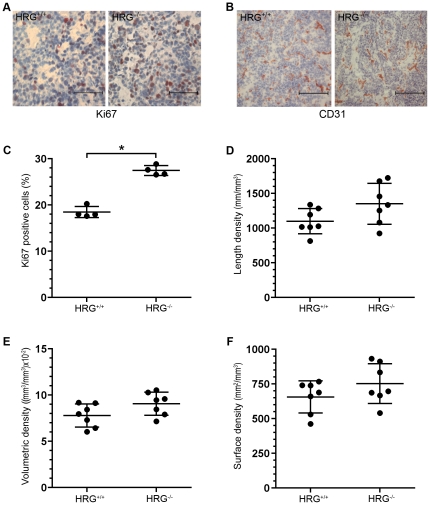
Figure 3. Proliferation and vascularization in tumors from RT2/HRG+/+ and RT2/HRG−/− mice.
(A, B) Immunohistochemical staining of tumor tissue from HRG+/+ and HRG−/− mice directed against Ki67 (A) and CD31 (B). (C) Quantification of immunohistochemical staining directed against Ki67 was performed on tumor sections from RT2/HRG+/+ and RT2/HRG−/− mice. Data are presented as percentage of Ki67 positive cells of total cell numbers. Each dot represents the value from an individual animal (n = 4 for each group). (D–F) Stereological quantification of vascular parameters: length, volumetric and surface densities. Each dot represents the mean value from one individual animal (n = 7 for each group). Statistical analyses were performed with a two-tailed Mann-Whitney test, vertical bars represent standard deviation, * p≤0.05. Scale bars represent 50 µm in A and 100 µm in B.

