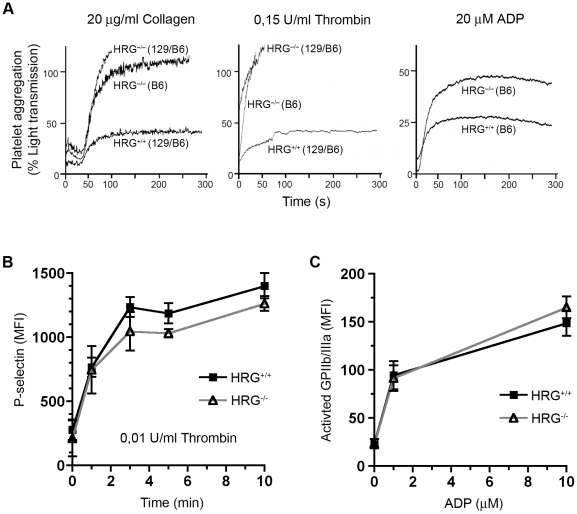
Figure 4. Enhanced aggregation of platelets in HRG−/− mice.
(A) Collagen, thrombin and ADP-induced platelet aggregation in PRP from HRG+/+ and HRG−/− mice on a pure C57BL/6 (B6) or on a mixed 129/Ola, C57BL/6 (129/B6) genetic background was measured with an aggregometry assay. Aggregation levels are represented by light transmission through PRP over time. (B–C) Flow cytometric analyses of thrombin- and ADP- induced activation of platelets presented by mean fluorescent intensity (MFI). Ligands were added at time = 0. Each symbol (squares = HRG+/+, open triangles = HRG−/−) represents the mean value from three independent measurements. Vertical bars represent standard deviation. (B) P-selectin after activation with 0,01 U/ml thrombin measured at 0, 1, 3, 5 and 10 minutes. (C) Activated fibrinogen receptor (GPIIb/IIIa) after 15 minutes stimulation with 1 or 10 µM ADP.

