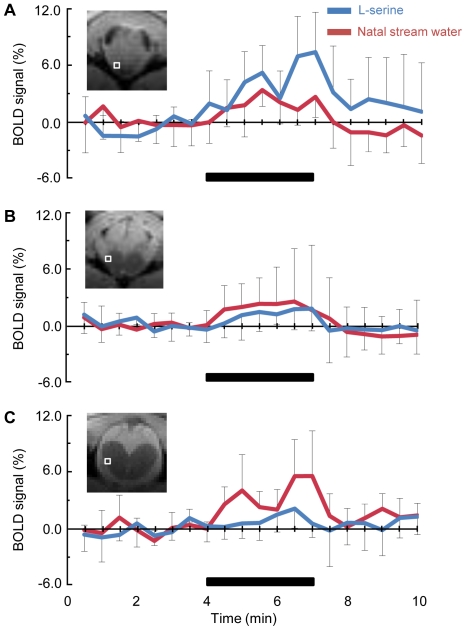
Figure 2. Time course of the BOLD signal changes induced by L-serine and natal stream water in the activation area.
A: olfactory bulb corresponding to Fig. 1Ci; B: telencephalon corresponding to Fig. 1Cii; C: telencephalon corresponding to Fig. 1Civ. These responses are averaged for six stimulus paradigms from the same fish. The locations of each area are shown as boxes in the insert MRI images. The bars indicate the stimulus period (3 min).

