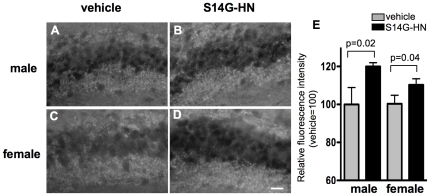
Figure 8. Effect of S14G-HN on synaptic degeneration.
A–D. Brain sections were subjected to immunostaining using anti-synaptophysin antibody followed by visualization with avidin-fluorescein. Representative images of hippocampal CA3 region of vehicle (A, C) and S14G-HN (B, D) treated mouse sections are shown. Bar = 20 µm E. Synaptophysin fluorescence intensity in 25 µmX80 µm area of the hippocampal CA3 region was measured. The relative value of S14G-HN-treated group (n = 3) to vehicle group (n = 3) is shown as mean±SD. P = indicates p value of t-test.

