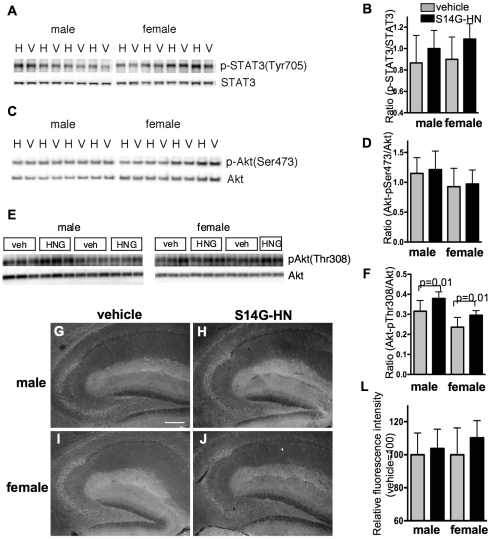
Figure 9. Effect of S14G-HN on activation of signaling molecules.
A, C, E. Immunoblot analysis of phosphorylation of STAT3 (A) and Akt (C,E). Brain homogenate of 3xTg-AD mice treated with S14G-HN (H or HNG) or vehicle (V or veh) was subjected to immunoblot analysis to detect phosphorylated proteins (upper panels) and total proteins (lower panels). B, D, F. Quantitative analysis of immunoblots. Intensity of bands represented in A, C, E were measured (number of animals; vehicle male = 7, female = 9, S14G-HN male = 9, female = 7) and the ratio of phosphorylated proten/total protein are shown as mean±SD. P = indicates p value of t-test. G–J. Brain sections were subjected to immunostaining using anti-phospho-Tyr705 STAT3 and anti-rabbit-DyLight488 antibodies. Representative images of hippocampal region of vehicle (G, I) and S14G-HN (H, J) treated mouse sections are shown. Bar = 200 µm. L. Quantitative analysis of immunohistochemistry. The fluorescence intensity of phosphorylated STAT3 in 75 µmX200 µm area of the hippocampal CA3 region was measured. The relative value of S14G-HN-treated group (n = 3) to vehicle group (n = 3) is shown as mean±SD. P = indicates p value of t-test.

