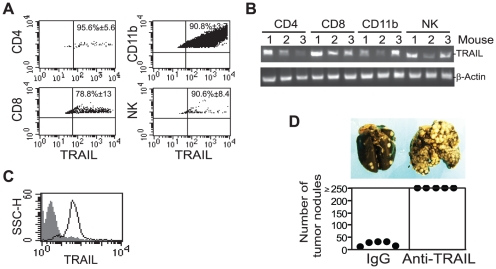
Figure 5. TRAIL expression and function in tumor-infiltrating immune cells.
A. Tumor-bearing lungs were excised approximately 21 days after tumor cell injection and analyzed by flow cytometry. The percentage of CD4+ T cells, CD8+ T cells, CD11b+ macrophages and NK cells in the tumor population were gated for TRAIL expression analysis. The percentage of TRAIL-positive cells in each subset of immune cells as shown in A were quantified and expressed as mean ± SD. B. TRAIL mRNA level in tumor-infiltrating immune cells. CD4+ T cells, CD8+ T cells, CD11b+ macrophage and NK cells were purified from the single cell suspension using cell type-specific mAb and magnet beads and analyzed for TRAIL transcript level by RT-PCR. Data from three mice are shown. C. Cell surface TRAIL protein level in tumor-specific CTLs. CTLs were stained with fluorescent dye-conjugated anti-TRAIL mAb and analyzed by flow cytometry. Isotype-matched IgG control staining is depicted as gray area, and TRAIL-specific staining is depicted as solid line. D. Function of TRAIL in suppression of colon carcinoma. CT26 cells (5×10⁴ cells/mouse) were mixed with IgG and anti-TRAIL neutralizing mAbs (50 µg/mouse), respectively, and injected into mice i.v. Two days later, IgG or anti-TRAIL mAb (100 µg/mouse) were injected into mice again. Mice were sacrificed 14 days after tumor transplantation and analyzed for lung metastasis. Images of lungs from representative mice are shown (top panel). The number of lung tumor nodules was enumerated in a single-blinded fashion. Each dot represents total counts from independent mice (bottom panel). Counts greater than 250 are expressed as ≥250. The difference between the IgG control and the anti-TRAIL mAb treatment group is statistically significant (p<0.01).

