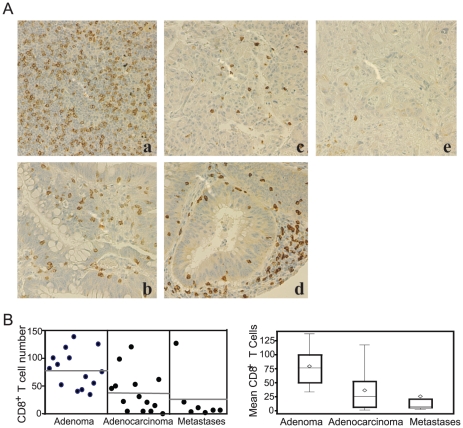
Figure 6. Tumor-infiltrating CD8+ T cells in human colon carcinoma.
A. Immunohistochemical staining of CD8+ T cells in human colon cancer specimens. CD8 immunoreactivity is shown as the brown-stained cells, whereas cells that are unreactive are indicated by the blue counterstain. Shown are representative images. a&b: adenoma; c&d: adenocarcinoma; e: liver metastases. B. Quantification of the number of CD8+ T cells in the colon cancer specimens. The number of CD8+ T cells in each specimen printed on the TMA as shown in A was counted. Each dot represents the average number of CD8+ T cells of three sections of the same tumor specimen (left panel). The mean CD8+ T cell number are: adenoma: 79.4, adenocarcinoma: 37.45, and liver/lung metastases: 25.69. Right panel: Statistical analysis of CD8+ T cells between different stages of tumors. One-way analysis of variance was used with a Bonferroni multiple comparison procedure to test for pair-wise post hoc differences between the three types of tumor specimens. Adenoma has a significantly higher mean CD8+ T cells than adenocarcinoma (p = 0.0051) and liver/lung metastases (p = 0.0036). Adenocarcinoma was not significantly different than liver/lung metastases in mean CD8+ T cells (p = 0.4957).

