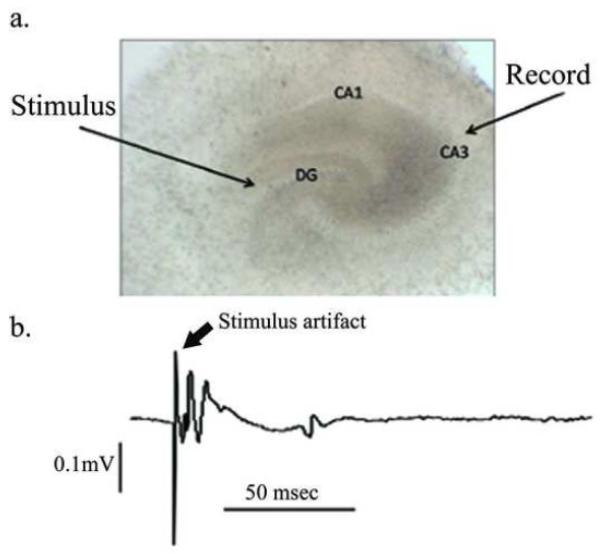
Figure 2.
A. Phase contrast photo (4X) of an OHSC at DIV 21 - Cell layers of the dentate gyrus (DG), CA3 and CA1 are clearly visible. B. Field potential recording of OHSC- To test viability of OHSCs during field potential recording, the stimulating electrode is placed in the DG while the recording electrode is placed over the CA3 cell region. The trace shows an example of an evoked field potential recording from a viable OHSC. The stimulus artifact is followed by the field potential.

