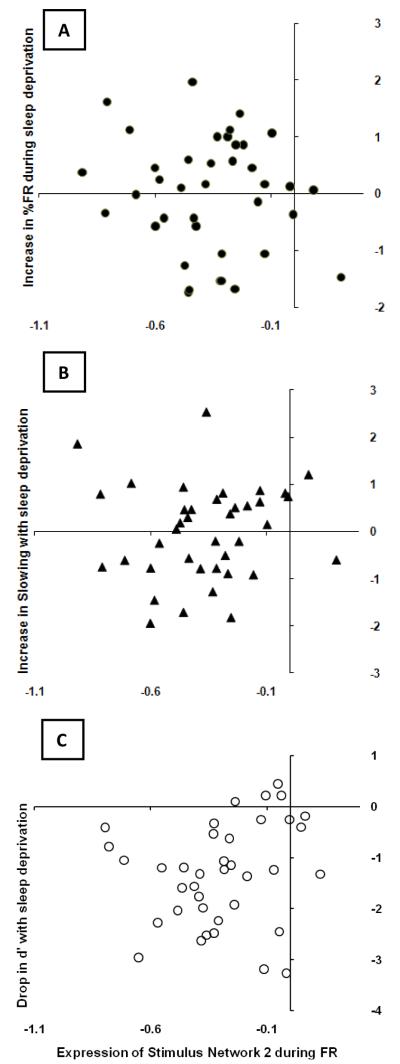
Figure 3. Brain-Behavior Relationships.
Observed expressions of encoding network 2 during failures to respond are plotted on the x-axis of each graph. The y-axis of each graph displays the z-scores of (A) the increase in %FR with sleep deprivation; (B) the increase in slowing with sleep deprivation; and (C) the drop in accuracy with sleep deprivation.

