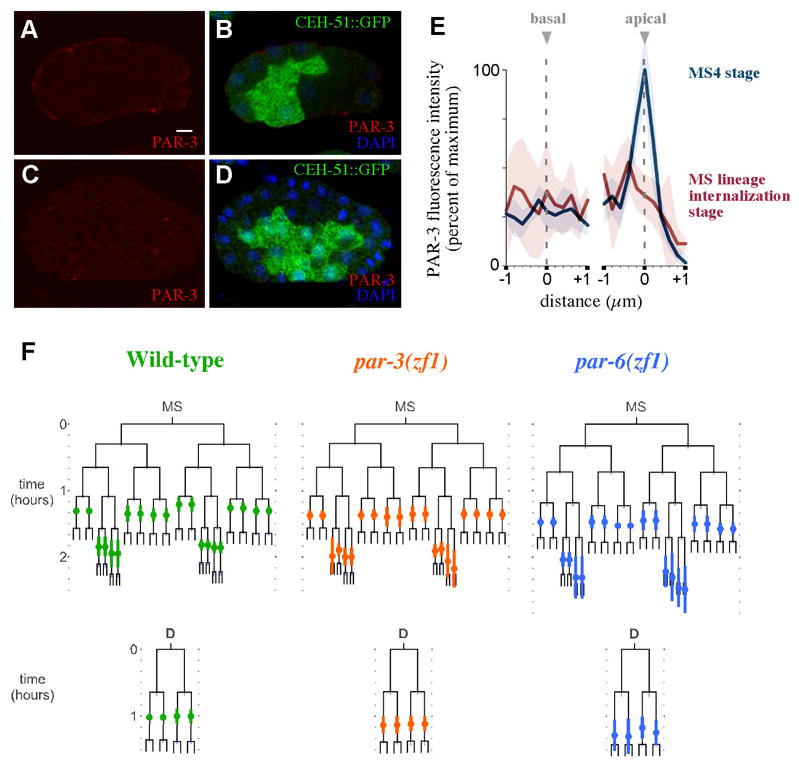
Fig. 5. PAR proteins do not play a major role in the timely internalization of MS and D lineage cells.

(A) CEH-51::GFP embryo at the MS4 cell stage immunostained for PAR-3 (left) and merged with GFP and DAPI images (right). (B) Same at MS16 stage. (C) Anti-PAR-3 fluorescence intensity quantified in MS4 stage (n=6, blue) and MS16 stage (n=5, red). Fluorescence intensities were calculated within 1 μm on either side of the apical and basal membranes. Shading indicates 95% confidence intervals. (D) MS and D lineages for wild-type (n=7), par-3(ZF1) (n=9), par-6(ZF1) (n=10) embryos. The timing of cell internalization for cells where internalization was observed is indicated by colored circles on the lineage, along with standard deviation bars. Scale bar: 5 μm.
