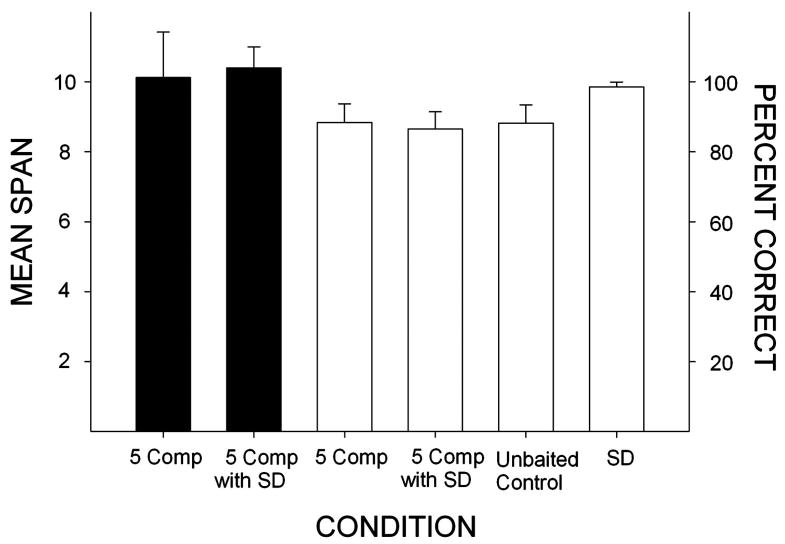
Figure 2.
Mean span (black bars/left axis) and percent correct on the span task (white bars/right axis) obtained during the last five sessions of the 5-Comparison Phase (5 Comp) and the five sessions before drug administration began for the 5-Comparison Phase with Added Simple Discrimination (5 Comp with SD). Also shown are the percent correct on unbaited control trials and on simple discrimination trials during the 5 Comp with SD phase. Error bars represent the standard error.

