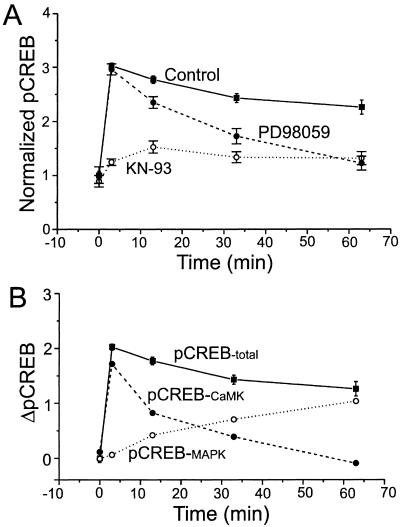
Figure 2.
Fast CaMK and slow MAPK pathways to pCREB. (A) Time course of the mean intensity of pCREB immunoreactivity under the conditions of Fig. 1. Values are normalized to baseline. (B) Calculated contributions of the MAPK pathway and MAPK-independent CaMK pathway to pCREB. The MAPK pathway contribution was taken as the difference between the control curve and the PD98059 curve in A. Note the slow rise of the pCREB-MAPK curve and the predominance of this pathway at 60 min. For isolating the pure CaMKIV pathway contribution, the KN-93 curve in A is understood to represent Control − MAPK contribution − MAPK-independent CaMK contribution. Because we have defined the MAPK contribution as Control − PD98059, the pure CaMKIV contribution can be represented as the difference between the PD98059 curve and the KN-93 curve (PD98059 − KN-93), as shown in B. Note the rapid rise and dominance of the CaMKIV pathway at early time points.

