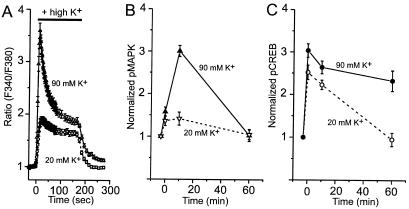
Figure 4.
Differential recruitment of the MAPK signaling pathway. (A) Dynamics of [Ca2+]i generated by mild (20 mM K+) or strong (90 mM K+) depolarization. Traces represent somatic [Ca2+]i measured with fura-2 ratiometric imaging. (B) Dynamics of pMAPK generated by mild (20 mM K+) or strong (90 mM K+) depolarization, determined with an antibody specific for pMAPK. (C) Dynamics of CREB phosphorylation generated by mild (20 mM K+) or strong (90 mM K+) depolarization.

