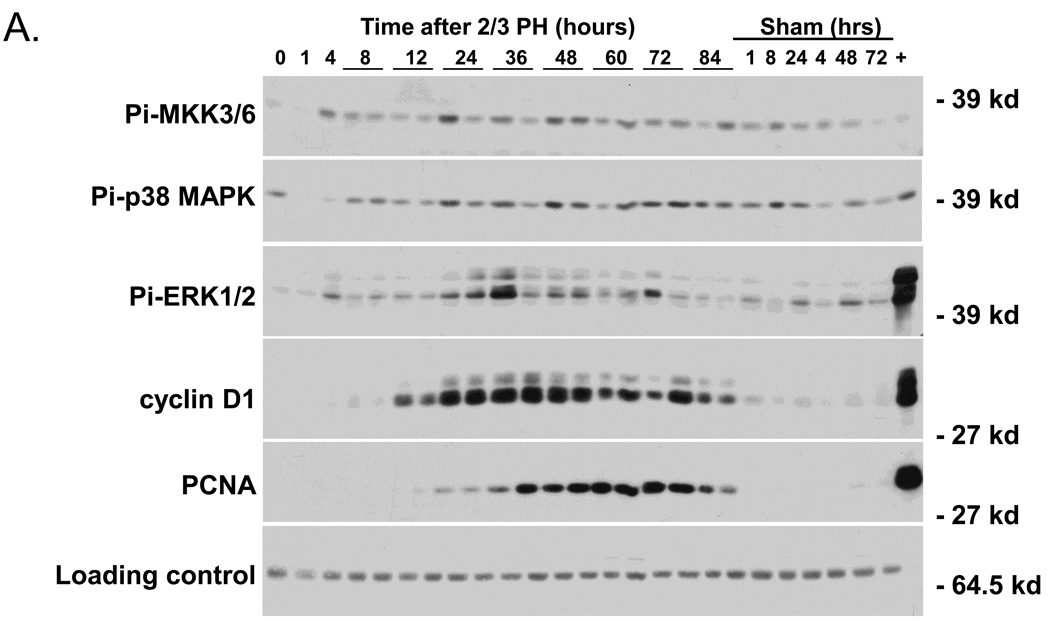
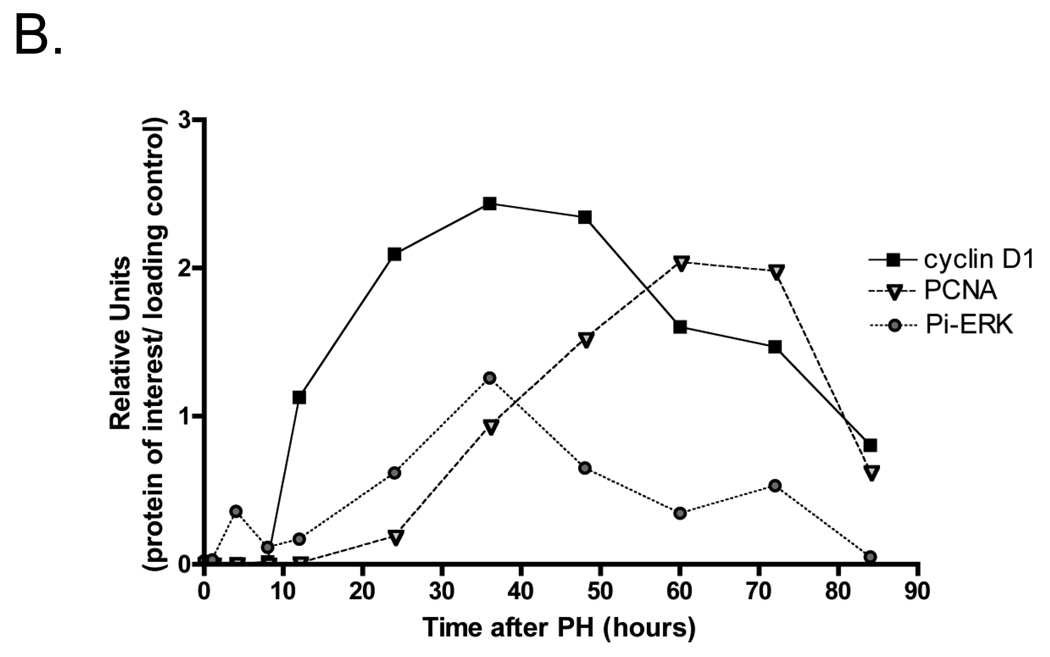
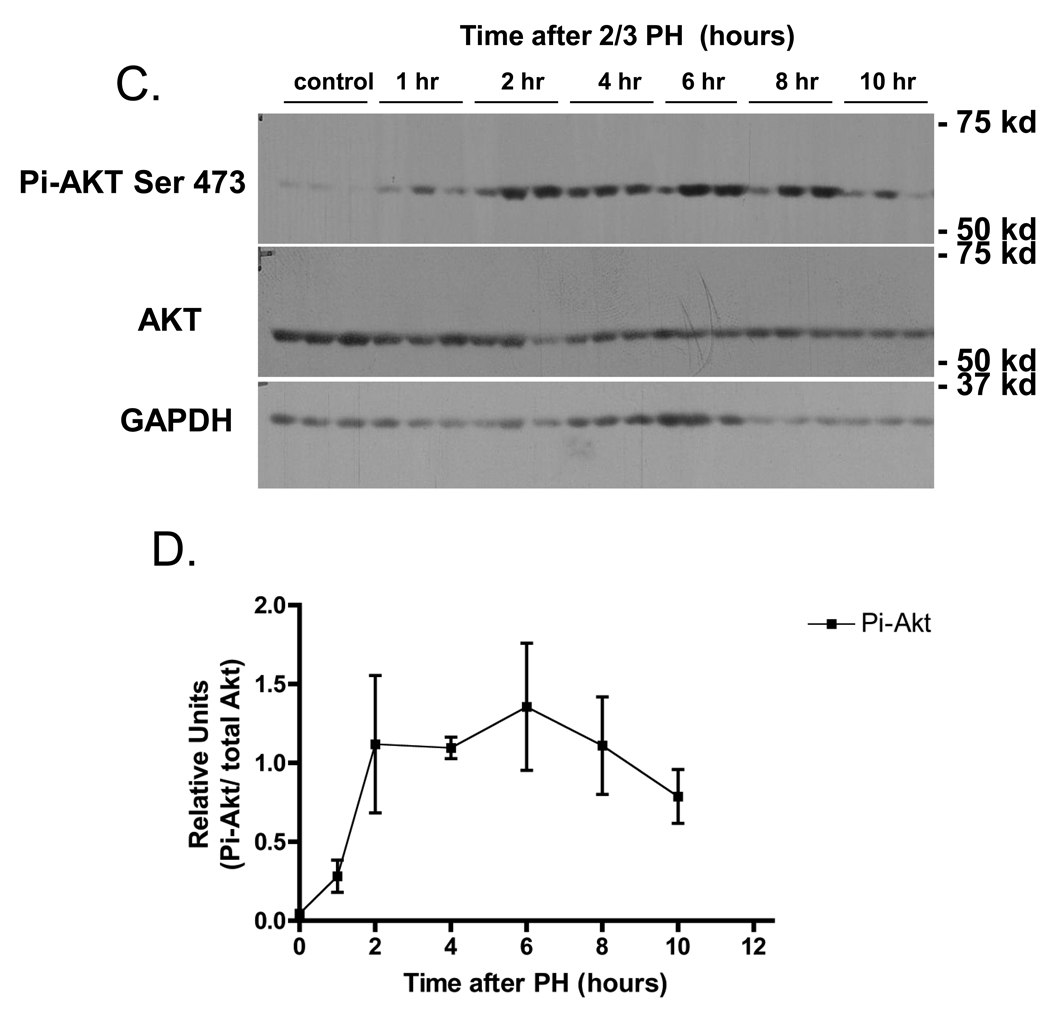
Fig 1.
Western blot analysis of cell signaling pathways following partial hepatectomy (PH). A) Expression of activated p38 MAPK with the upstream activator Pi-MKK3/6, and known markers of liver regeneration Pi-ERK1/2, cyclin D1, and PCNA (n=2 mice/PH time points). “+” indicates that lysates from AML12 cells treated for 5’ with EGF were loaded as a positive control. B) Densitometry analysis of Pi-ERK1/2, cyclin D 1, and PCNA. Data points are the average of two independent values. C) Expression of phosphorylated AKT (S473) with total AKT and GAPDH from 3 individual mice were averaged after PH (n=3). D) Densitometry analysis of Pi-AKT normalized to levels of total Akt. Each point represents the mean (+/−SEM) of three mice. These data represent 2 independent experiments. Molecular weight markers are shown on the right.


